Motion Lab 3.5.12
1. Describe how your group created each of the graphs. Be sure to give specific details including directions and movement.
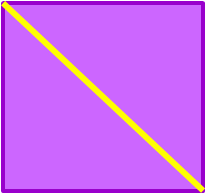
Graph 1
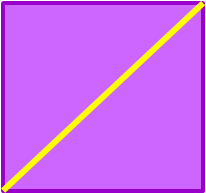
Student A backed up from the device at a steady pace.
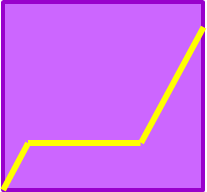
Graph 2
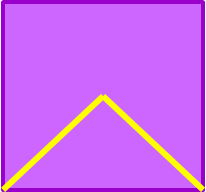
Student A backed up at a steady pace then walked forward at a steady pace.
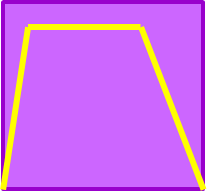
Graph 3
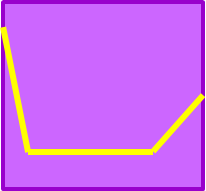
Student A walked forwards, stops, then walked backwards.
Graph 4
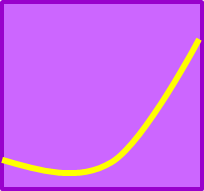
Student A backed up fast, increasing speed.
Graph 5
Student A started far back, then walked forward at a steady pace.
Graph 6
Student A backed up, stayed in one place, then backed up more.
Graph 7
Student A backed up fast at a steady pace, stayed there for awhile, then came forward.
Graph 8
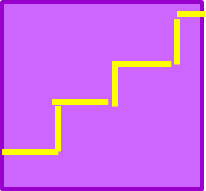
Student A hopped backwards, waited for a second, then continued.
2. Which two graphs were the most difficult? Why were they difficult?
Graph 8 was particularly difficult, as the graph is near impossible to recreate. Graph 2 was also difficult, as it was hard to recreate the peak, going at a constant speed.
Graph 8 was particularly difficult, as the graph is near impossible to recreate. Graph 2 was also difficult, as it was hard to recreate the peak, going at a constant speed.
